


Getting Started with Grafana, Prometheus, and Loki: A Beginner's Guide with Code and Visualizations.📊


Prerequisites:⏮️
NodeJs, Javascript
Docker
Folder Structure📂:
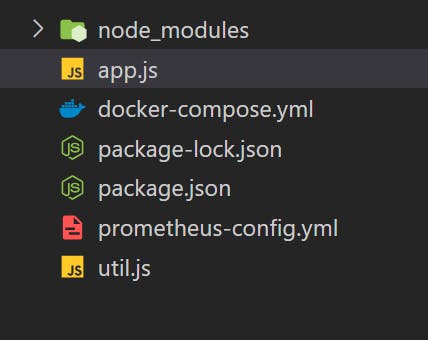
NodeJs application:
You can also create or work with your own NodeJs application
In the current working directory, create a folder and run the command given below in the terminal.
#initializing NodeJs enviornment
npm init -y
# installing required packages
npm install express nodemon prom-client winston winston-loki
Create a file app.js and util.js:
Content of app.js
// Importing required modules
const express = require("express");
const { doSomeHeavyTask } = require("./util");
const client = require("prom-client"); // Metrics library
const app = express();

// Setting the port for the server
const PORT = 8000 || process.env.PORT;

// Collecting default metrics using prom-client
const collectDefaultMetrics = client.collectDefaultMetrics;

// Handling GET request on the root endpoint
app.get("/", (req, res) => {
  logger.info("Request is sent on / ");
  res.send("Hello World");
});

// Handling GET request on the /metrics endpoint
app.get("/metrics", async (req, res) => {
  res.setHeader("Content-Type", client.register.contentType); // Setting response header
  const Registry = client.Registry;
  const register = new Registry();
  collectDefaultMetrics({ register }); // Collecting default metrics
  const metrics = await register.metrics(); // Getting metrics
  res.send(metrics); // Sending metrics as response
});

// Handling GET request on the /slow endpoint
app.get("/slow", async (req, res) => {
  try {
    logger.info("Request is sent on /slow "); // Logging request information
    const timeTaken = await doSomeHeavyTask(); // Performing heavy task
    return res.json({
      status: "Success",
      message: `Task completed in ${timeTaken} seconds`,
    });
  } catch (error) {
    logger.error("Error in /slow ", error); // Logging error information
    res.json({ status: "Error", message: error.message });
  }
});

// Starting the server and listening on the specified port
app.listen(PORT, () => {
  console.log(`Server is running on port ${PORT}`);
});
Content of util.js
// Function to get a random value from an array
function getRandomValue(arr) {
    return arr[Math.floor(Math.random() * arr.length)];
}

// Function to simulate a heavy task
function doSomeHeavyTask() {
    return new Promise((resolve, reject) => { // Creating a new promise
        const timeTaken = getRandomValue([10, 20, 30, 40, 50]); // Getting a random time from the array
        setTimeout(() => {
            if (Math.random() < 0.5) { // Randomly rejecting the promise with a probability of 0.5
                reject(new Error('Random error occurred')); // Rejecting the promise with an error
            } else {
                resolve(timeTaken); // Resolving the promise with the time taken
            }
        }, timeTaken * 2);
    });
}

module.exports = { doSomeHeavyTask };
To run the above code and see the output:
nodemon app.js
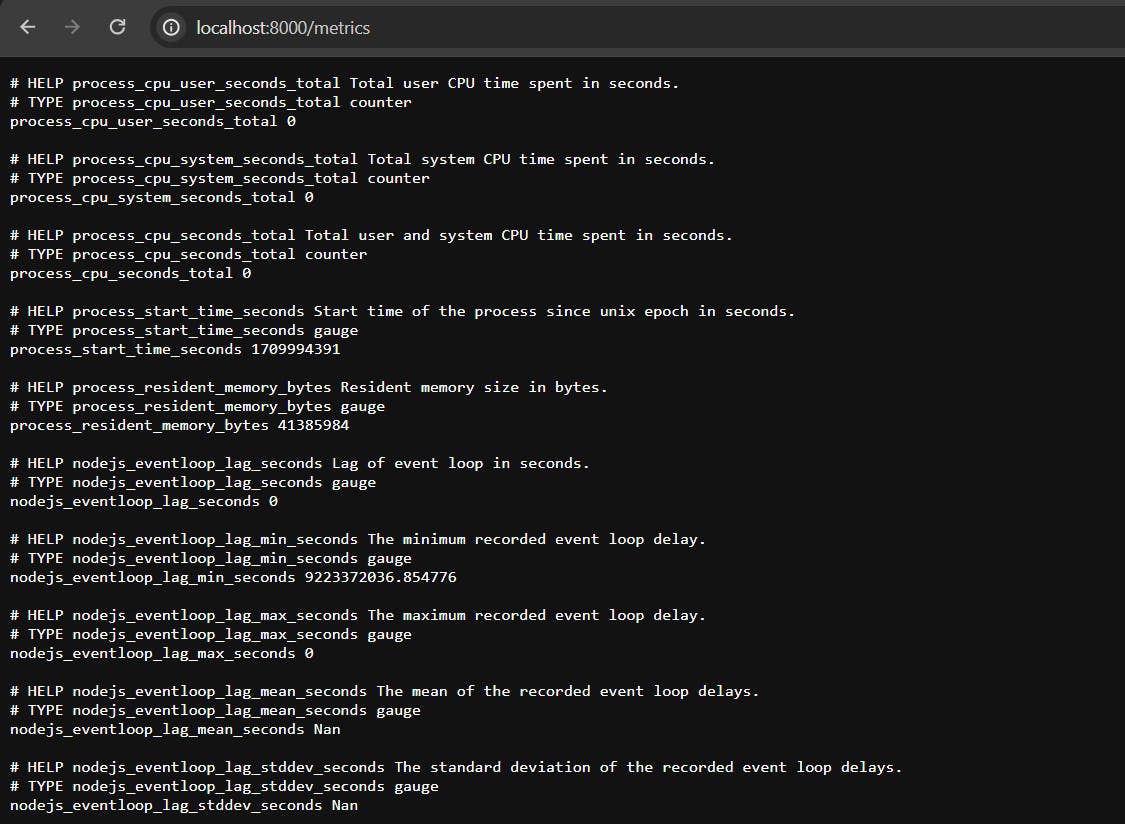
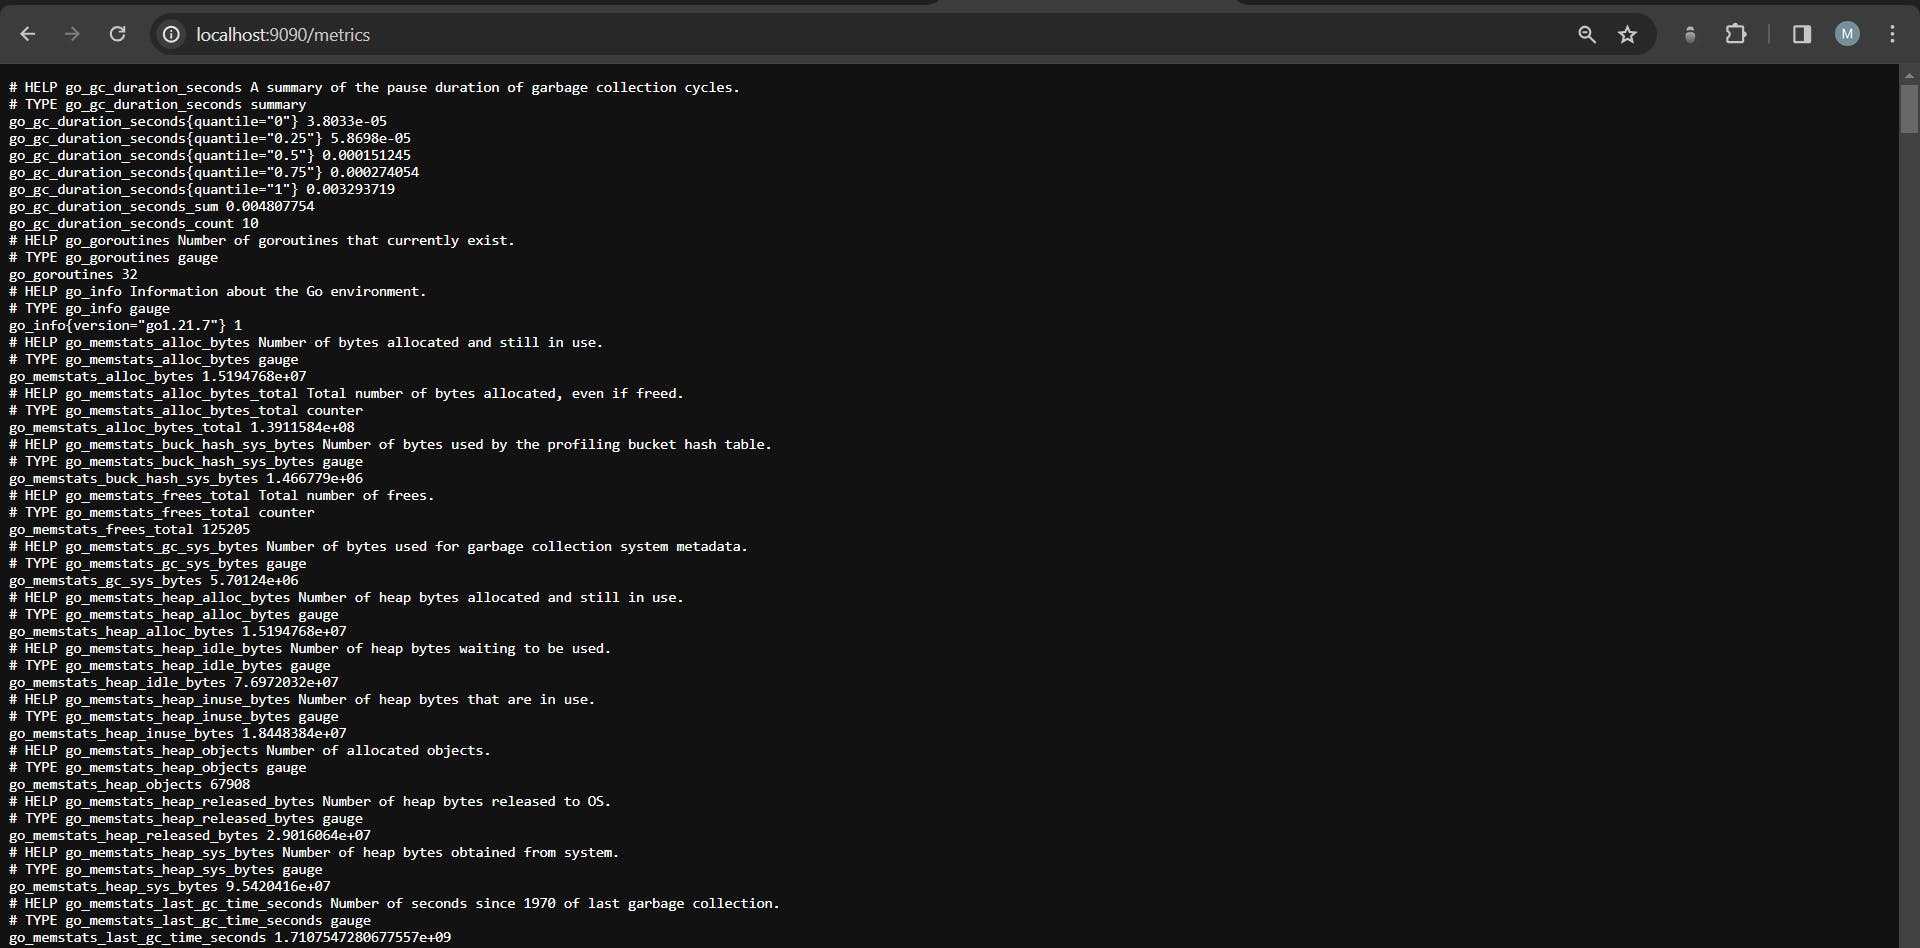
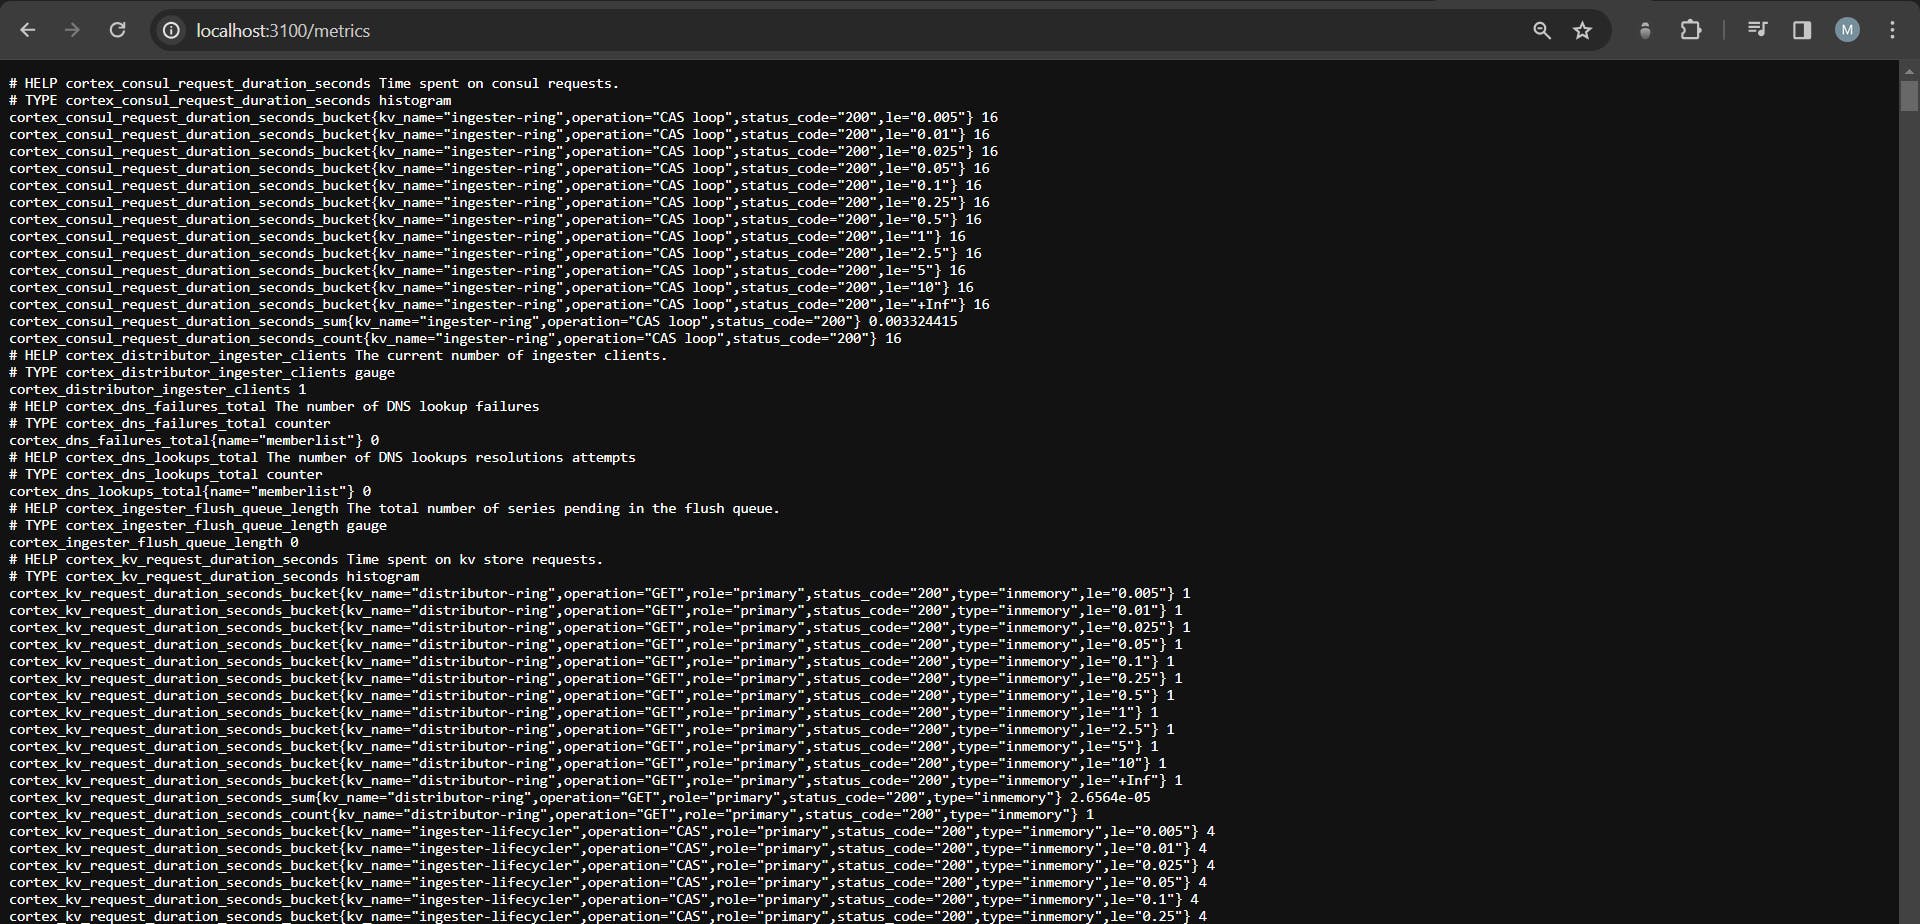
Output
on /metric route.
What is Prometheus and Grafana?
Prometheus is an open-source monitoring toolkit designed for reliability and scalability, particularly suited for dynamic containerized environments. It features a multi-dimensional data model and enables flexible queries for analyzing real-time and historical data.
Prometheus employs a pull-based approach to scrape metrics from configured targets at regular intervals. Prom-client is a Prometheus client library tailored for Node.js applications, facilitating the exposure of metrics in the Prometheus format. It provides a straightforward API for instrumenting code, collecting metrics, and exporting them in the Prometheus exposition format.
Grafana is an open-source analytics and visualization platform that allows users to query, visualize, and understand metrics collected from various data sources. It supports a wide range of data sources, including Prometheus, Elasticsearch, InfluxDB, and more. With Grafana, users can create customizable dashboards to monitor and analyze data in real time, making it a popular choice for monitoring and observability in modern IT environments.
Implementing Prometheus and Grafana👨🏻💻
We will use the built-in image Grafana from the docker image hub and expose it to port 3000.
Prometheus will throw all default metrics on /metrics route.
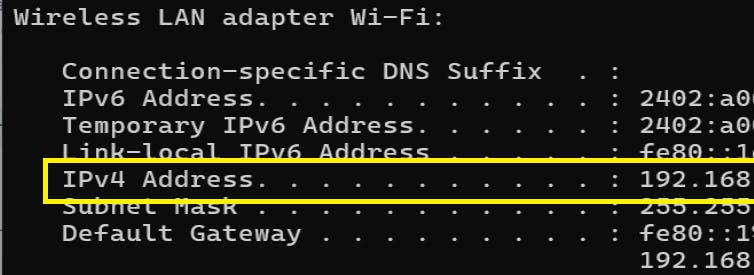
How to find your static IP:
ipconfig
Output:
Add file name as prometheus-config.yml in the same folder, which will ensure the scraping of the metrics :
# Global configuration options applicable to all scrape targets
global:
  # Interval at which Prometheus scrapes metrics from targets (e.g., 4 seconds)
  scrape_interval: 4s

scrape_configs:
  # Job configuration for scraping metrics from a target named "prometheus"
  - job_name: prometheus
    # Define static targets that Prometheus should scrape metrics from
    static_configs:
      # List of static targets, each identified by its IP address and port
      - targets: ["<NODE_IP_ADDRESS>:8000"]
Add a DockerFile in the current working folder:
# Define the version of Docker Compose syntax being used
version: "3"

# Define the services that compose your application
services:
  # Define a service named "prom-server"
  prom-server:
    # Use the official Prometheus Docker image from Docker Hub
    image: prom/prometheus
    # Map port 9090 of the container to port 9090 on the host
    ports:
      - 9090:9090
    # Mount the local prometheus-config.yml file into the container at /etc/prometheus/prometheus.yml
    volumes:
      - ./prometheus-config.yml:/etc/prometheus/prometheus.yml
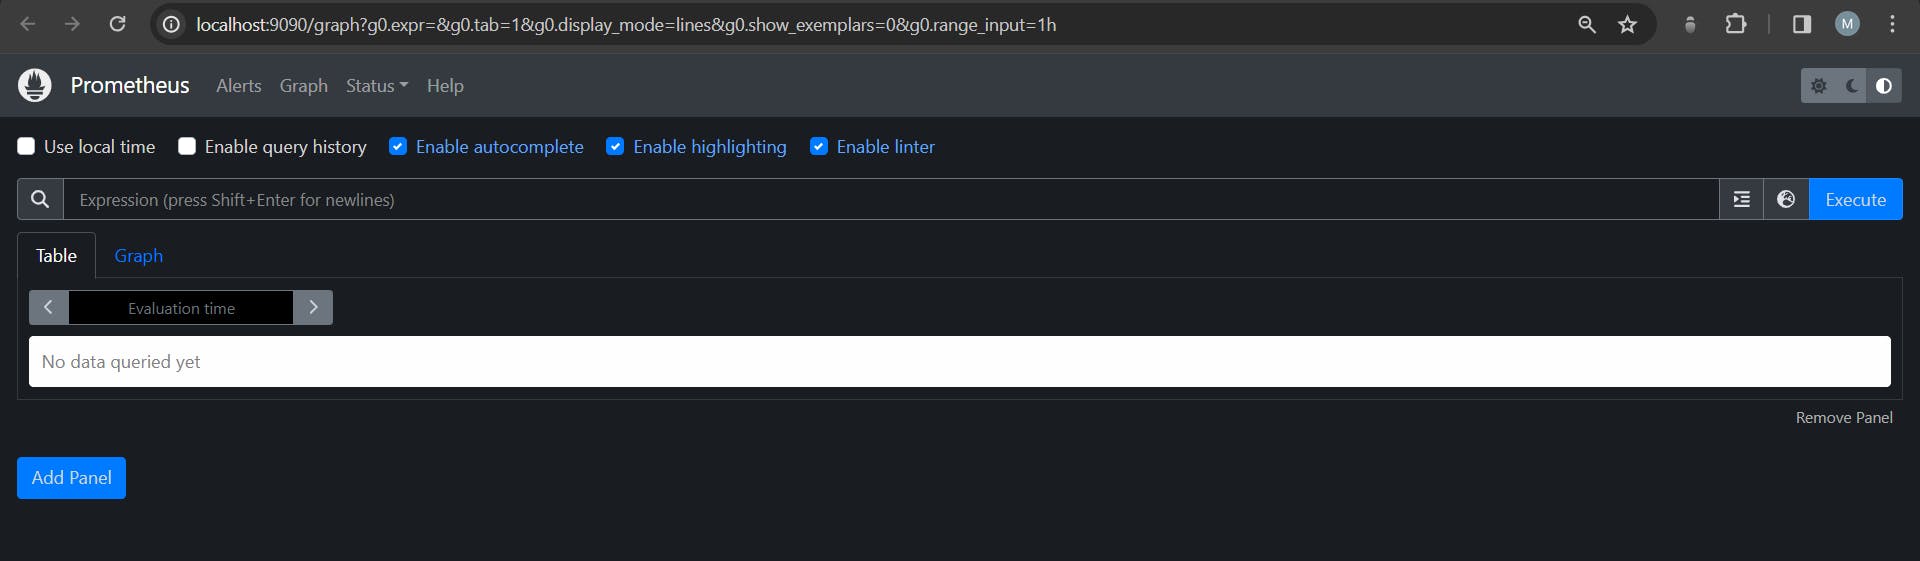
To run the Prometheus server on port 9090:
docker compose up
Output:
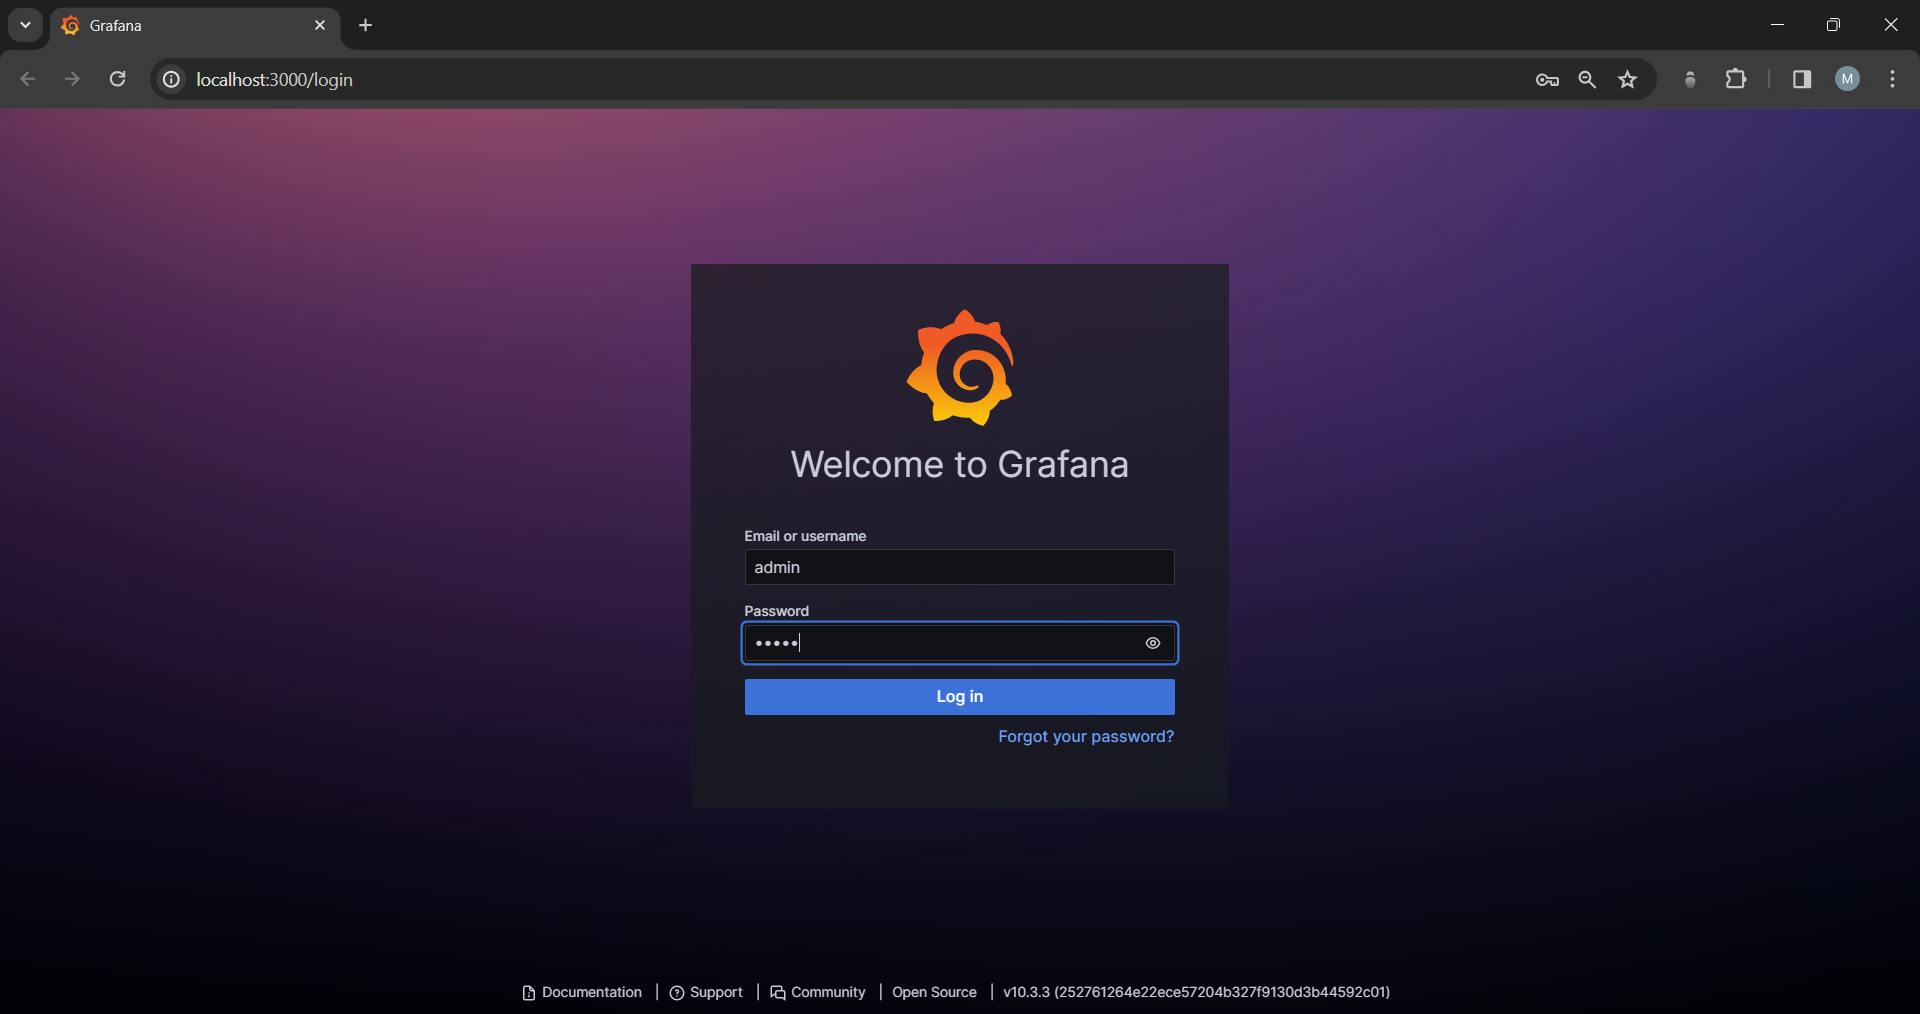
To import the Grafana dashboard to our local machine run the below code:
docker run -d -p 3000:3000 --name=grafana_final grafana/grafana-oss
Output:
Default :
username: admin
password: admin
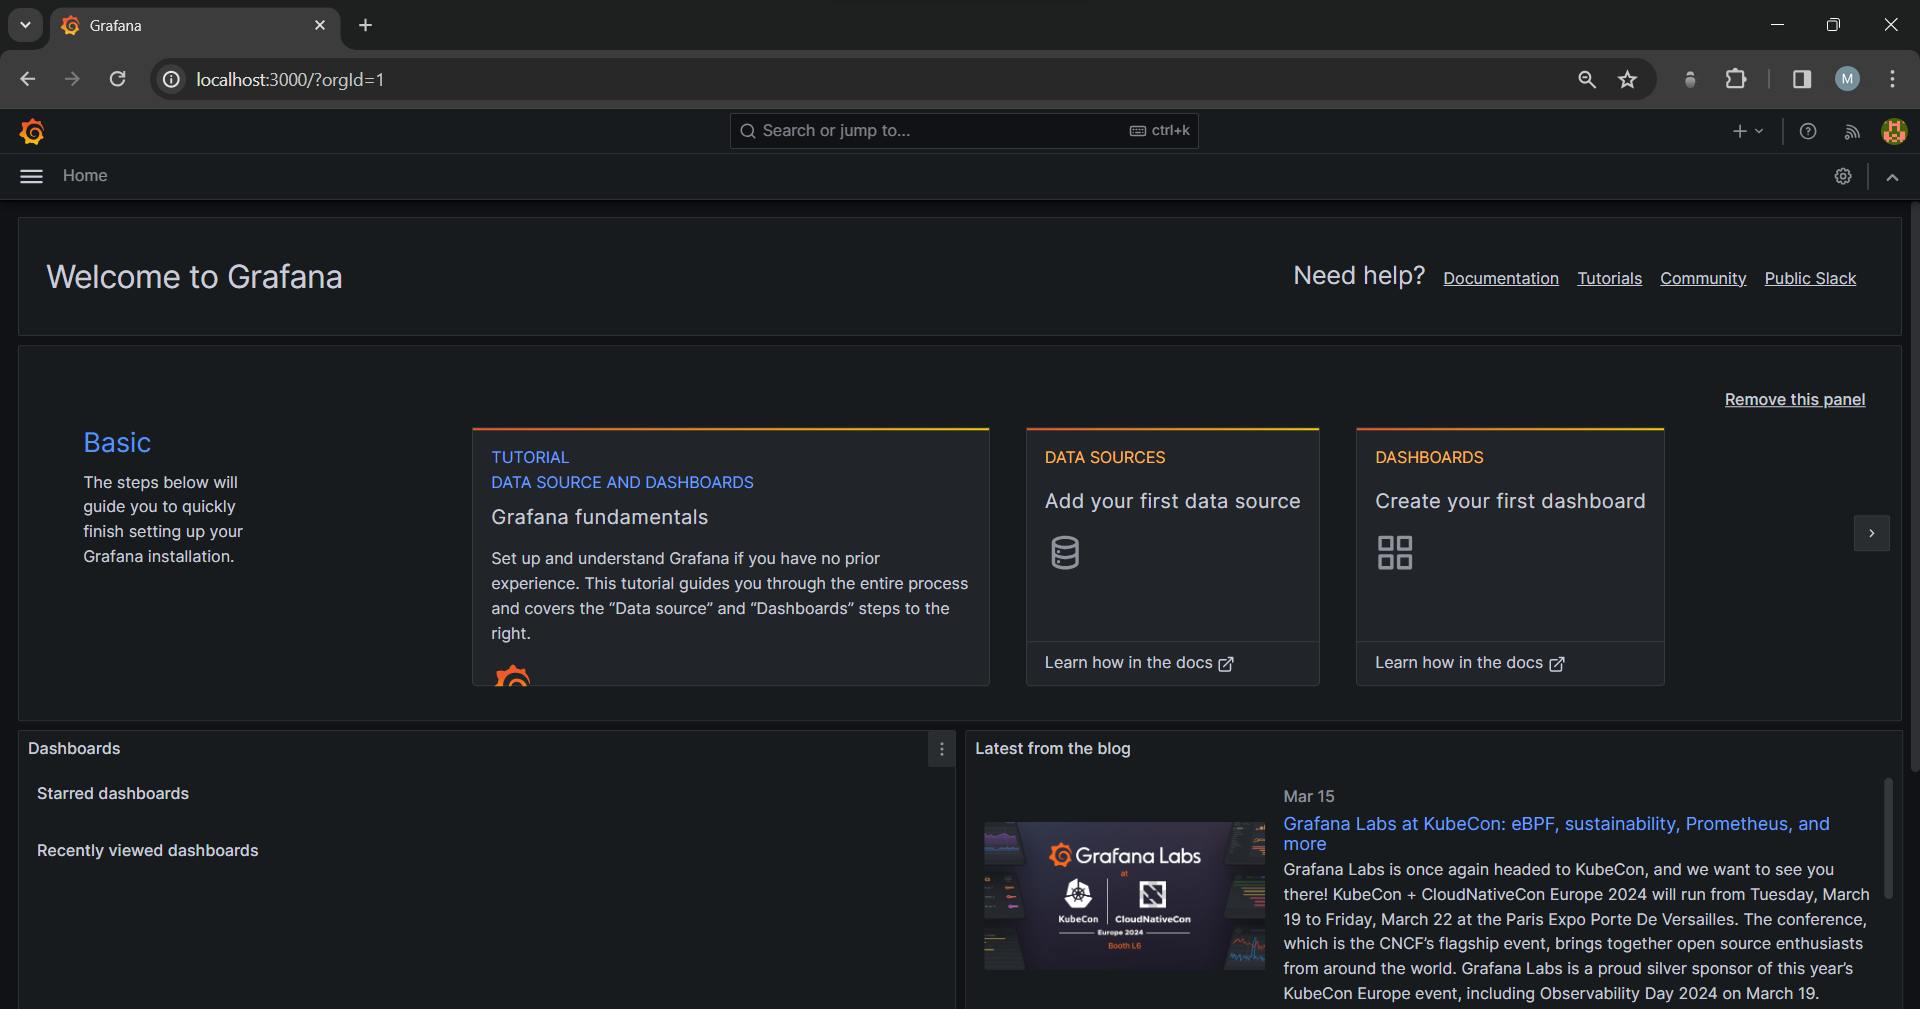
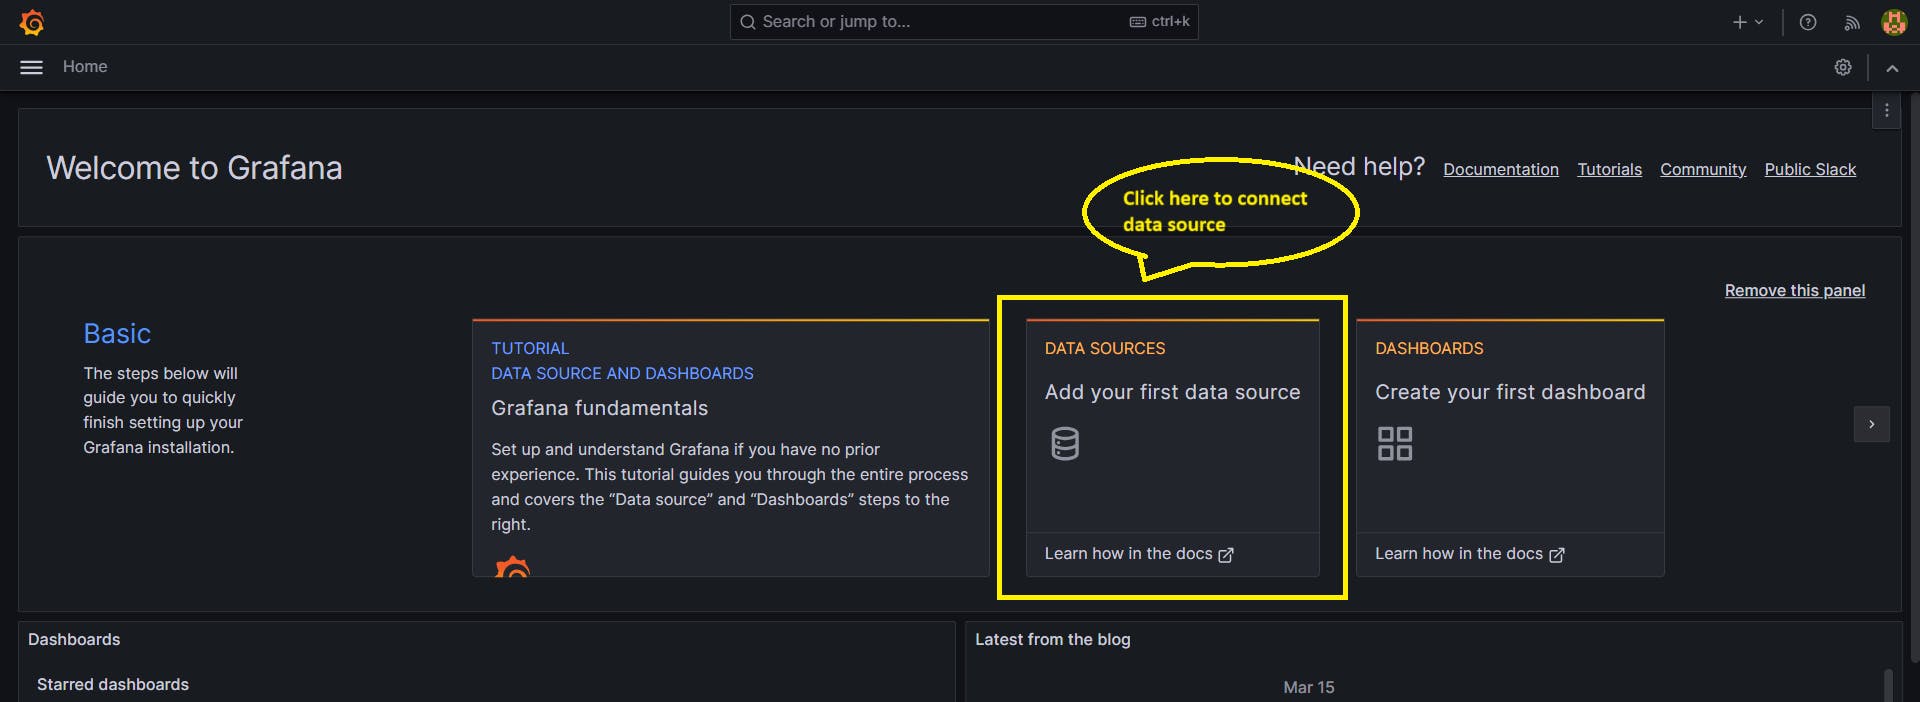
Steps to connect Prometheus source into Grafana📉
Step 1: Select the data source dialog box
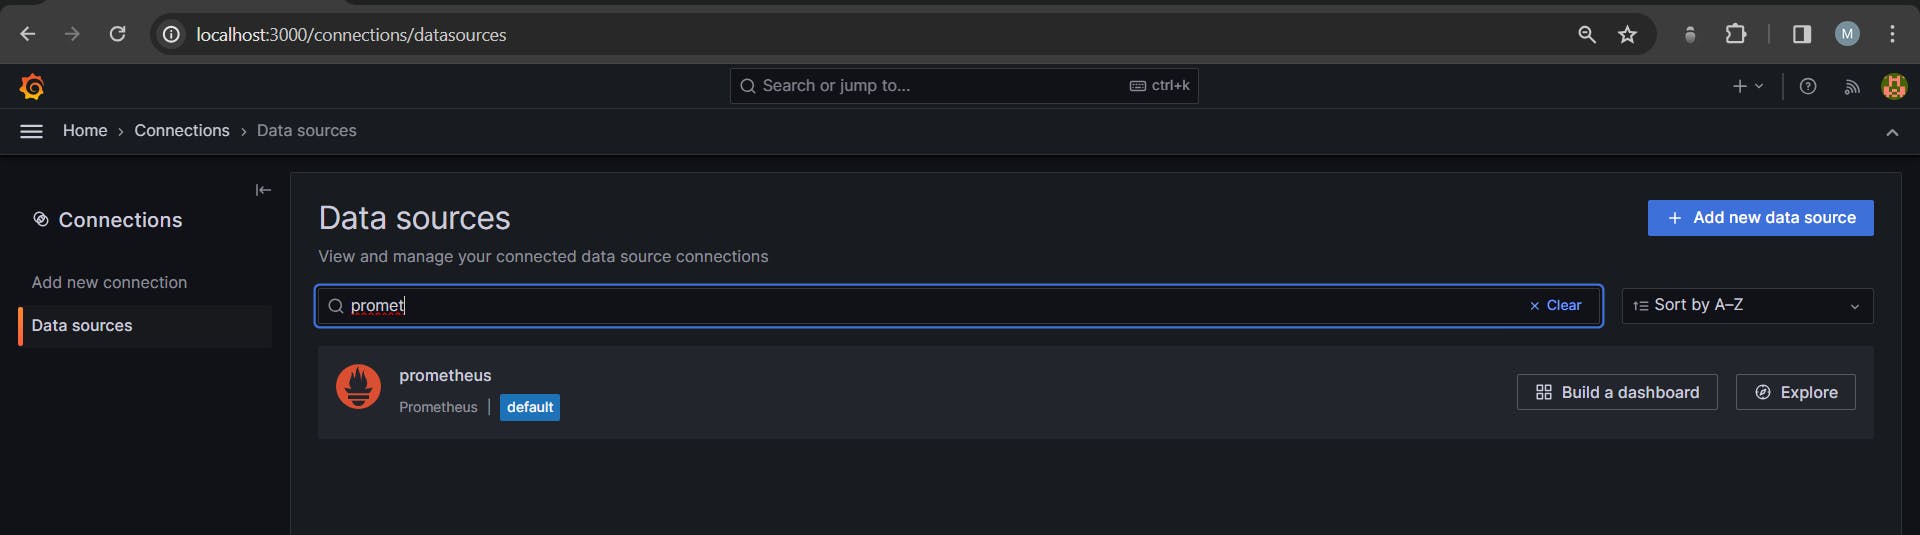
Step 2: Select the data source as Prometheus
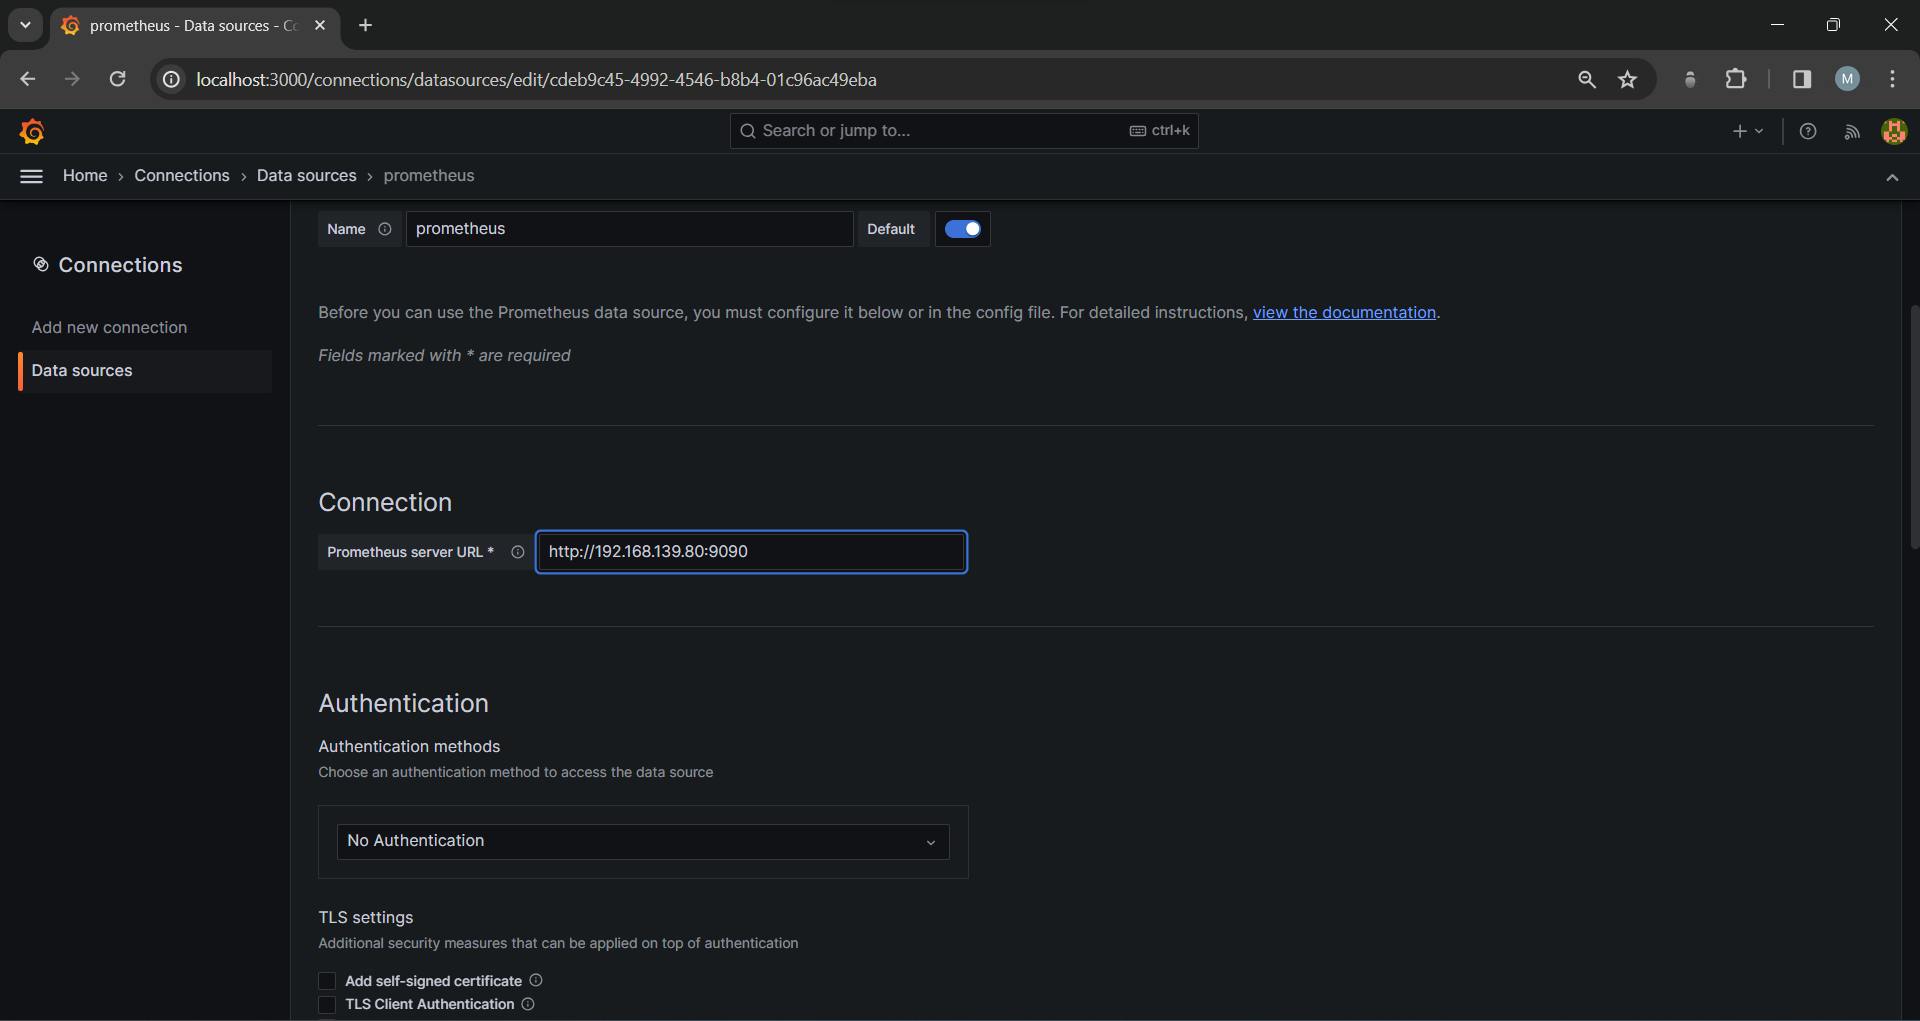
Step 3: Add the Connection URL of the Prometheus server
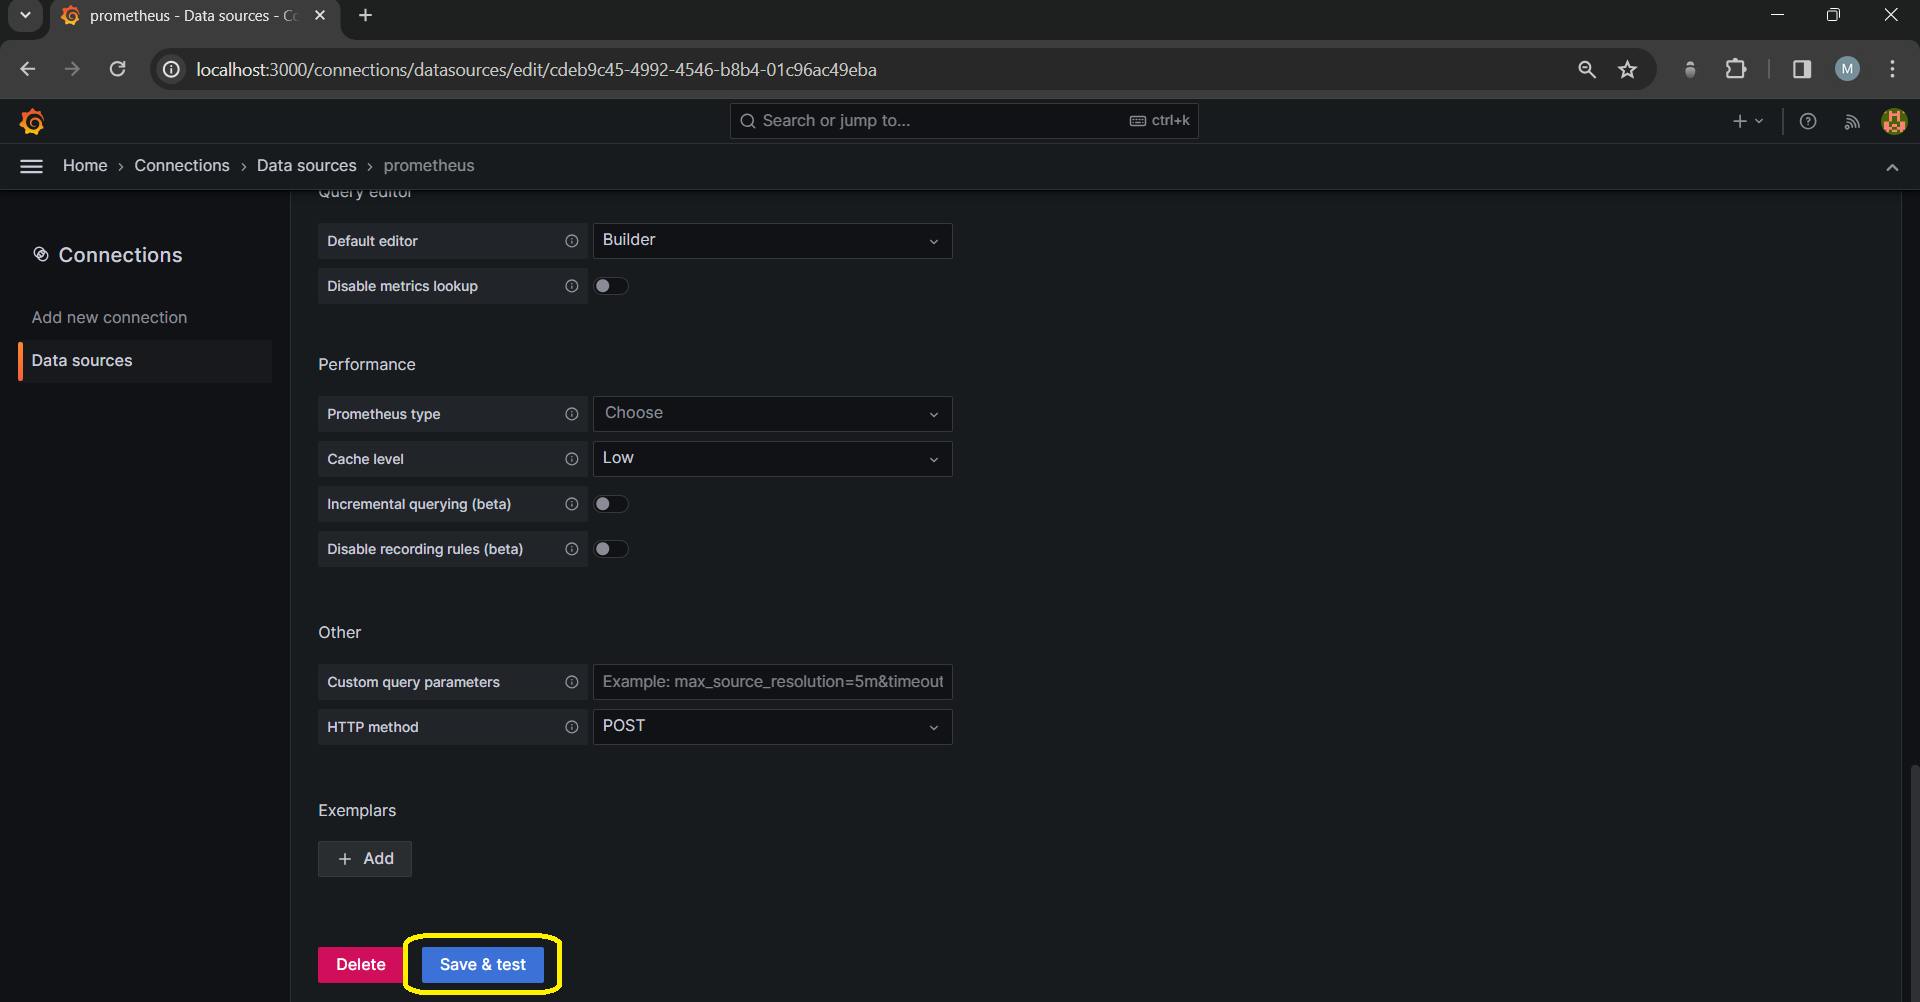
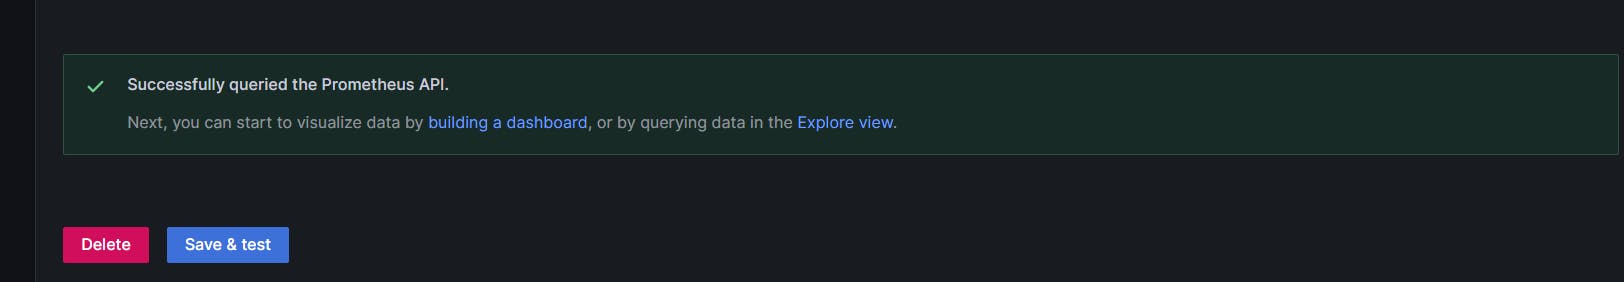
Step 4: Click on the Save & test button, and keep all other settings as default
Now you have successfully connected to the Prometheus API:
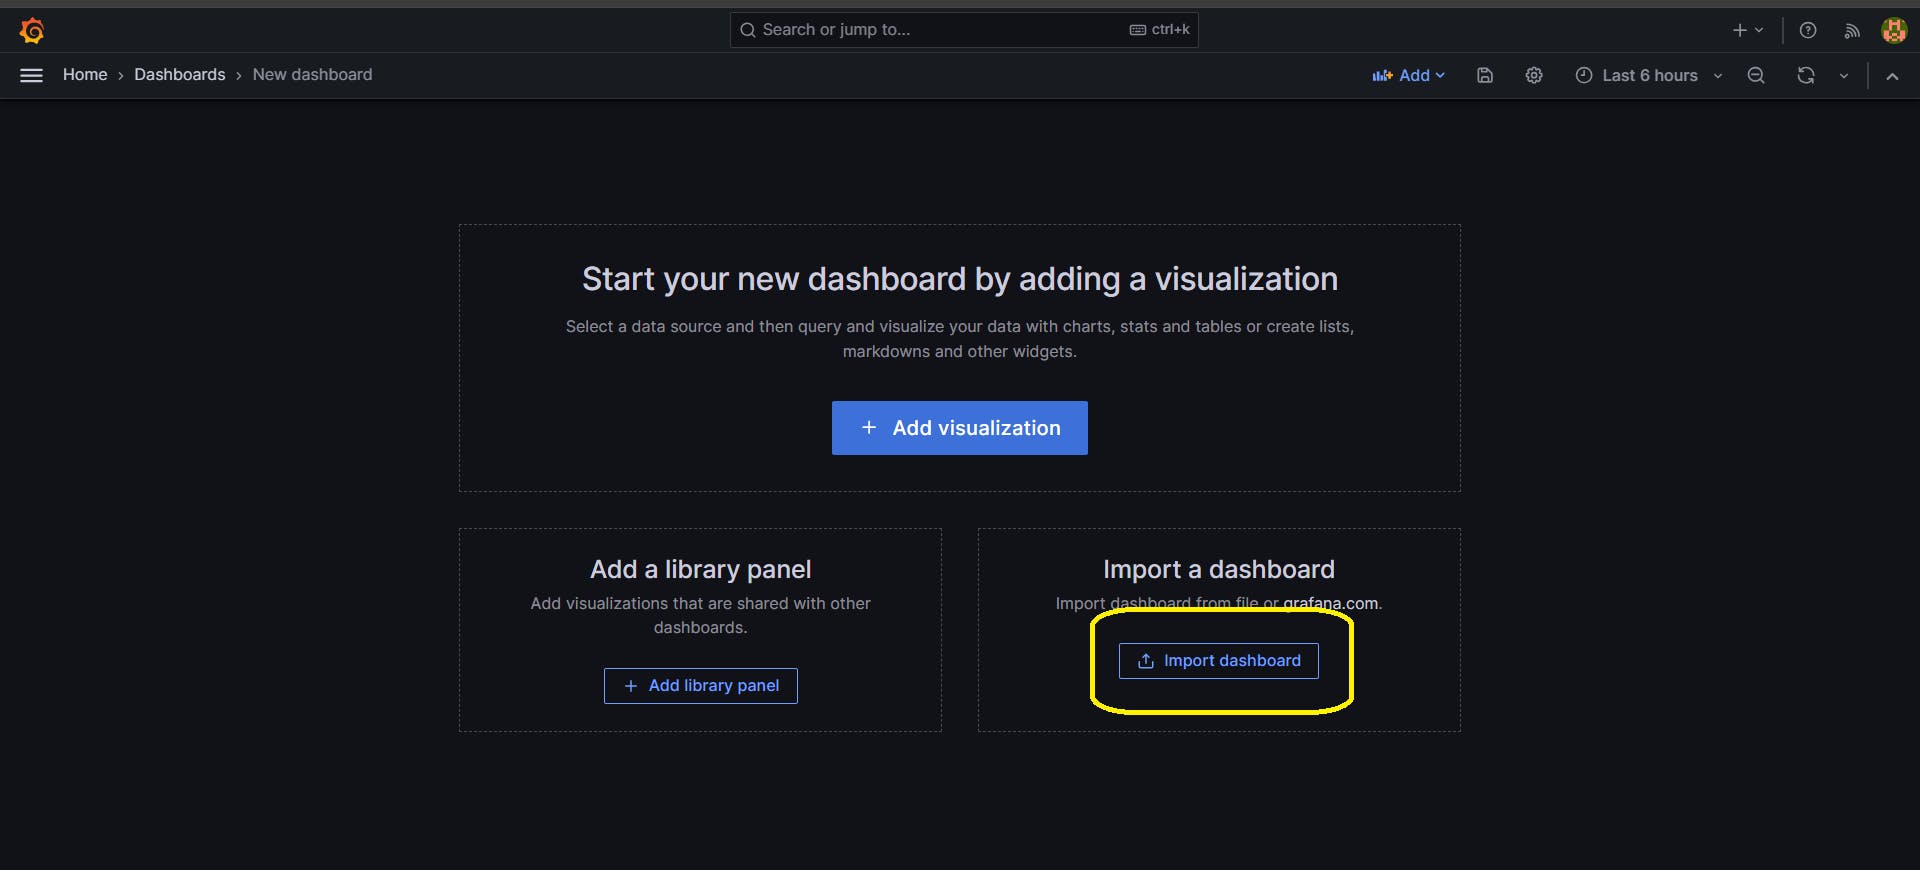
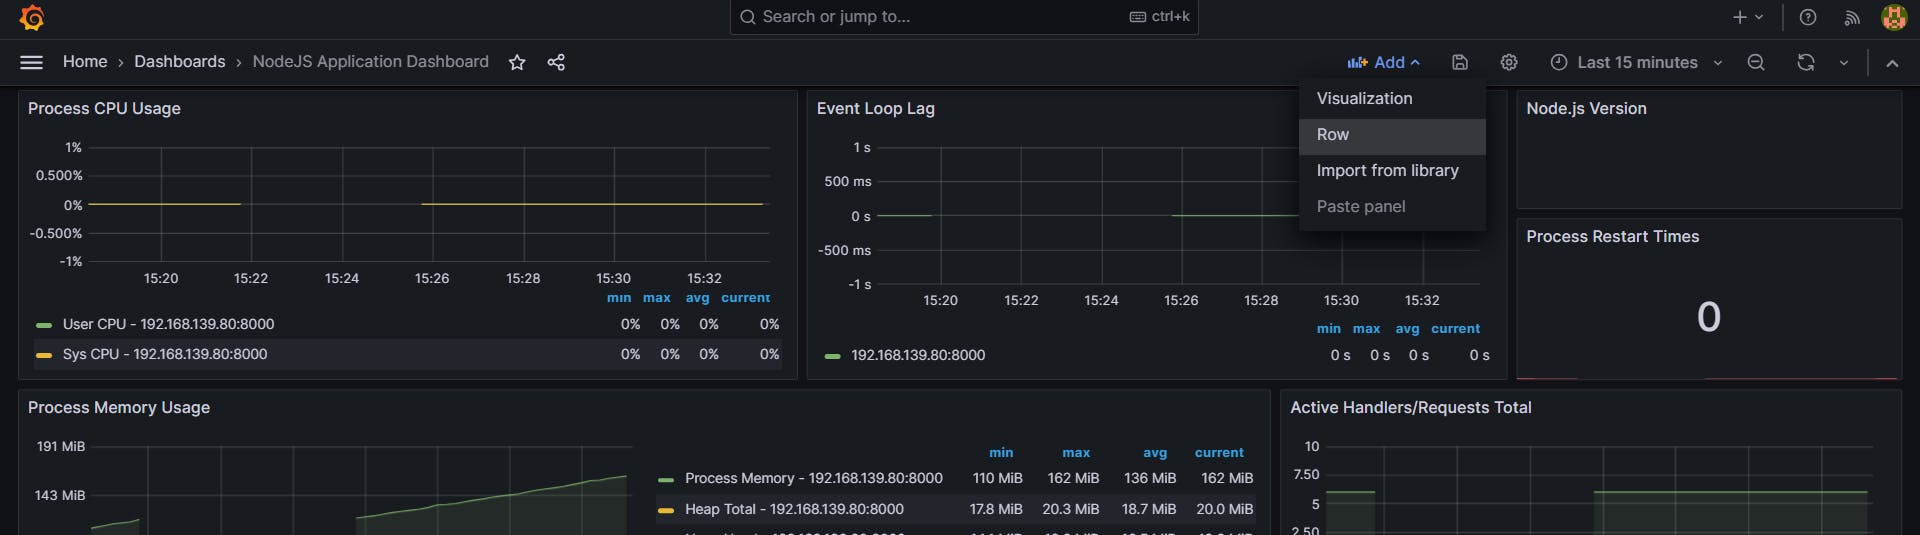
Step 5: Next is to create a dashboard to see the given metrics:
We can import the dashboard from the internet in two ways:
Add a library panel
Import a dashboard (we will use this)
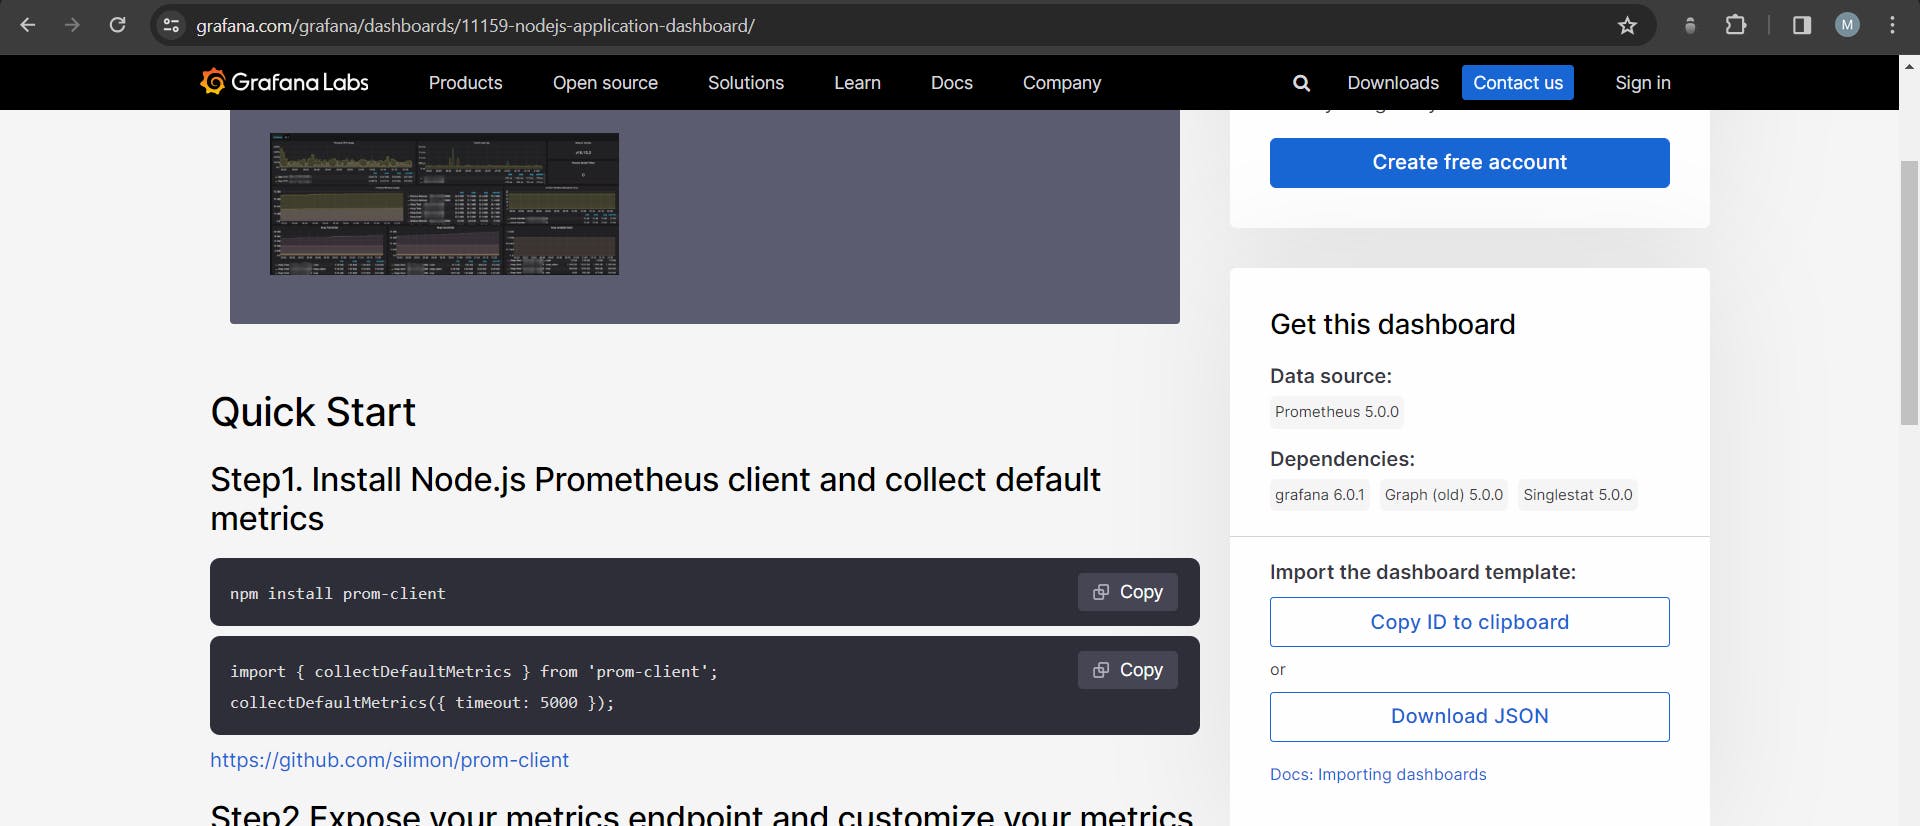
Step 6: Let's go with import dashboard with id from internet for default NodeJS application dashboard from this link:
https://grafana.com/grafana/dashboards/11159-nodejs-application-dashboard/
Click on the Copy ID to clipboard
Step 7: Paste the ID into the Grafana Import dashboard and click on the Load button
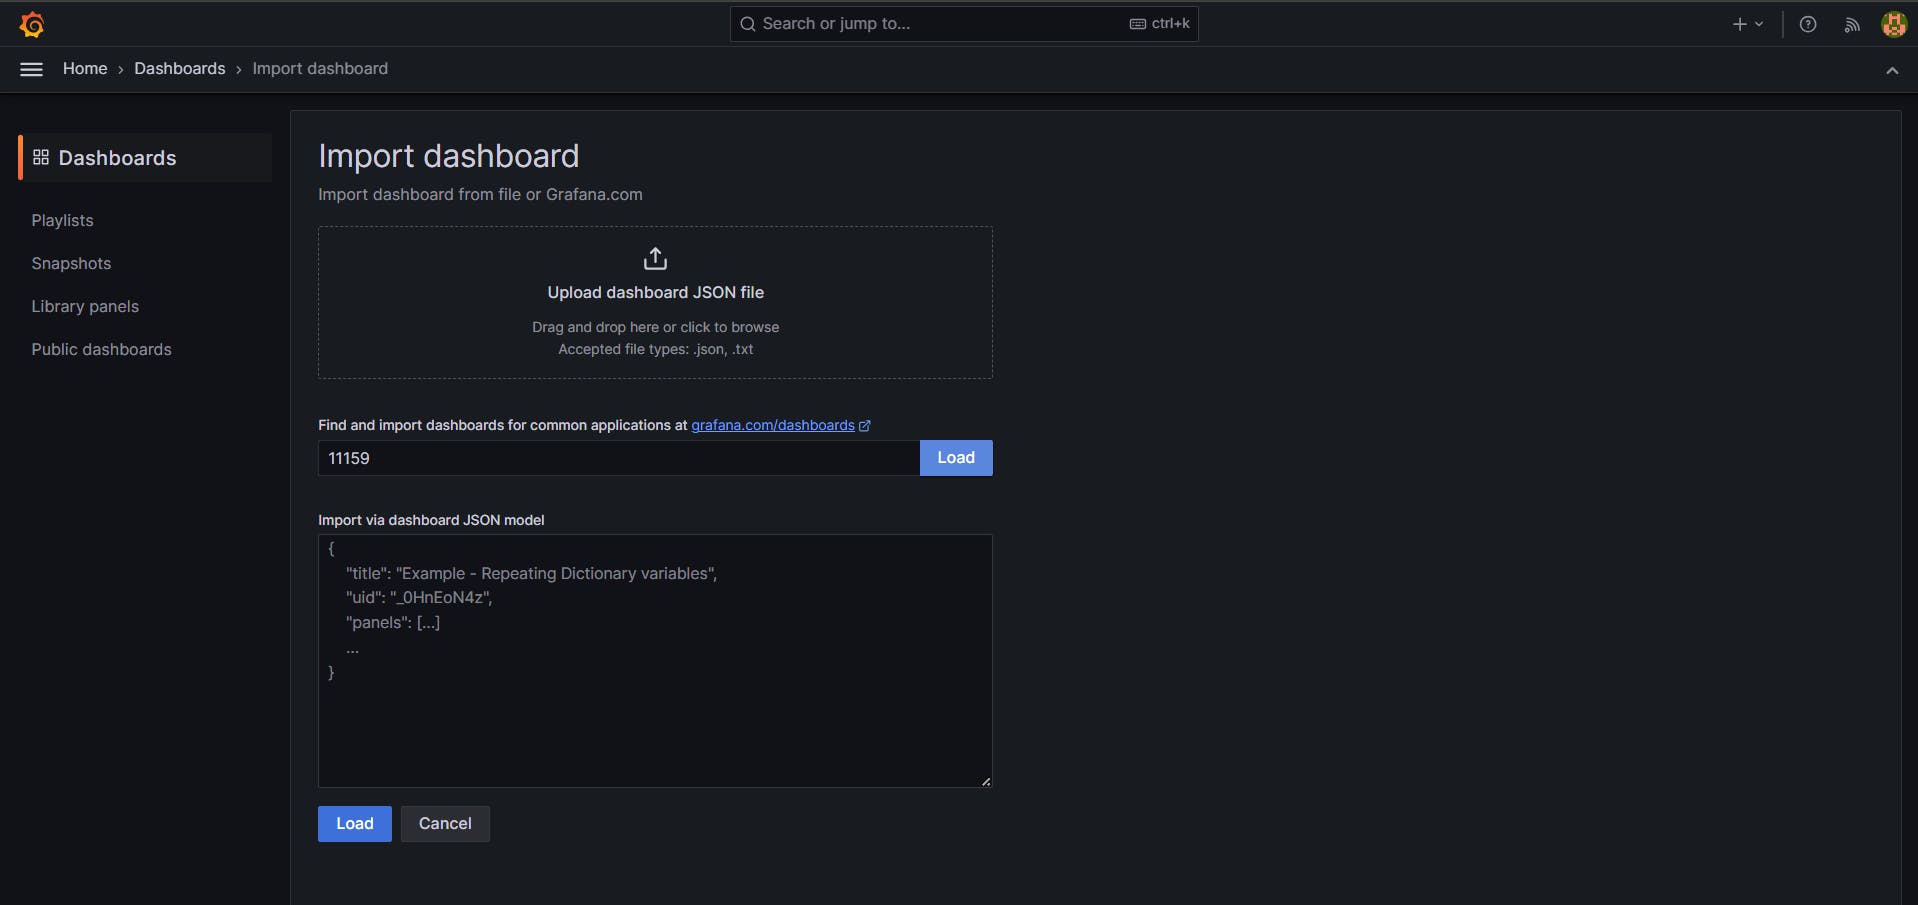
Finally, we will get the dashboard.
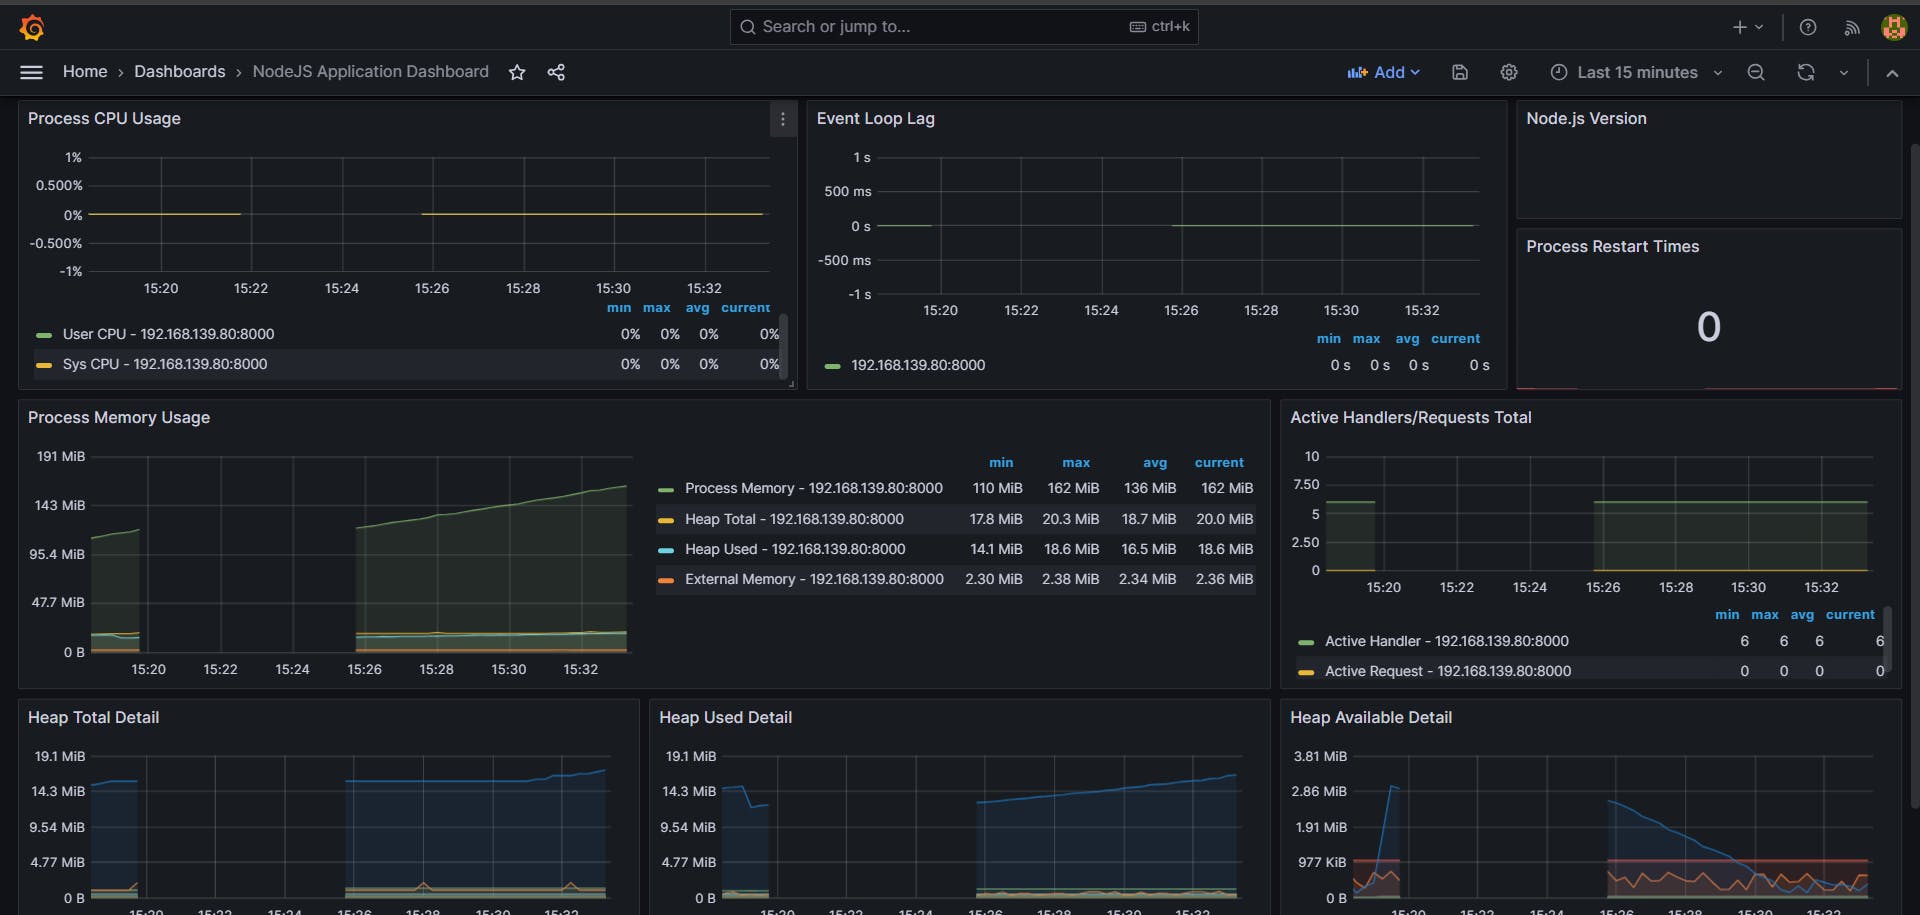
Congratulations!!! You have reached this step🎉

With this, you can get a detailed analysis of your node app.
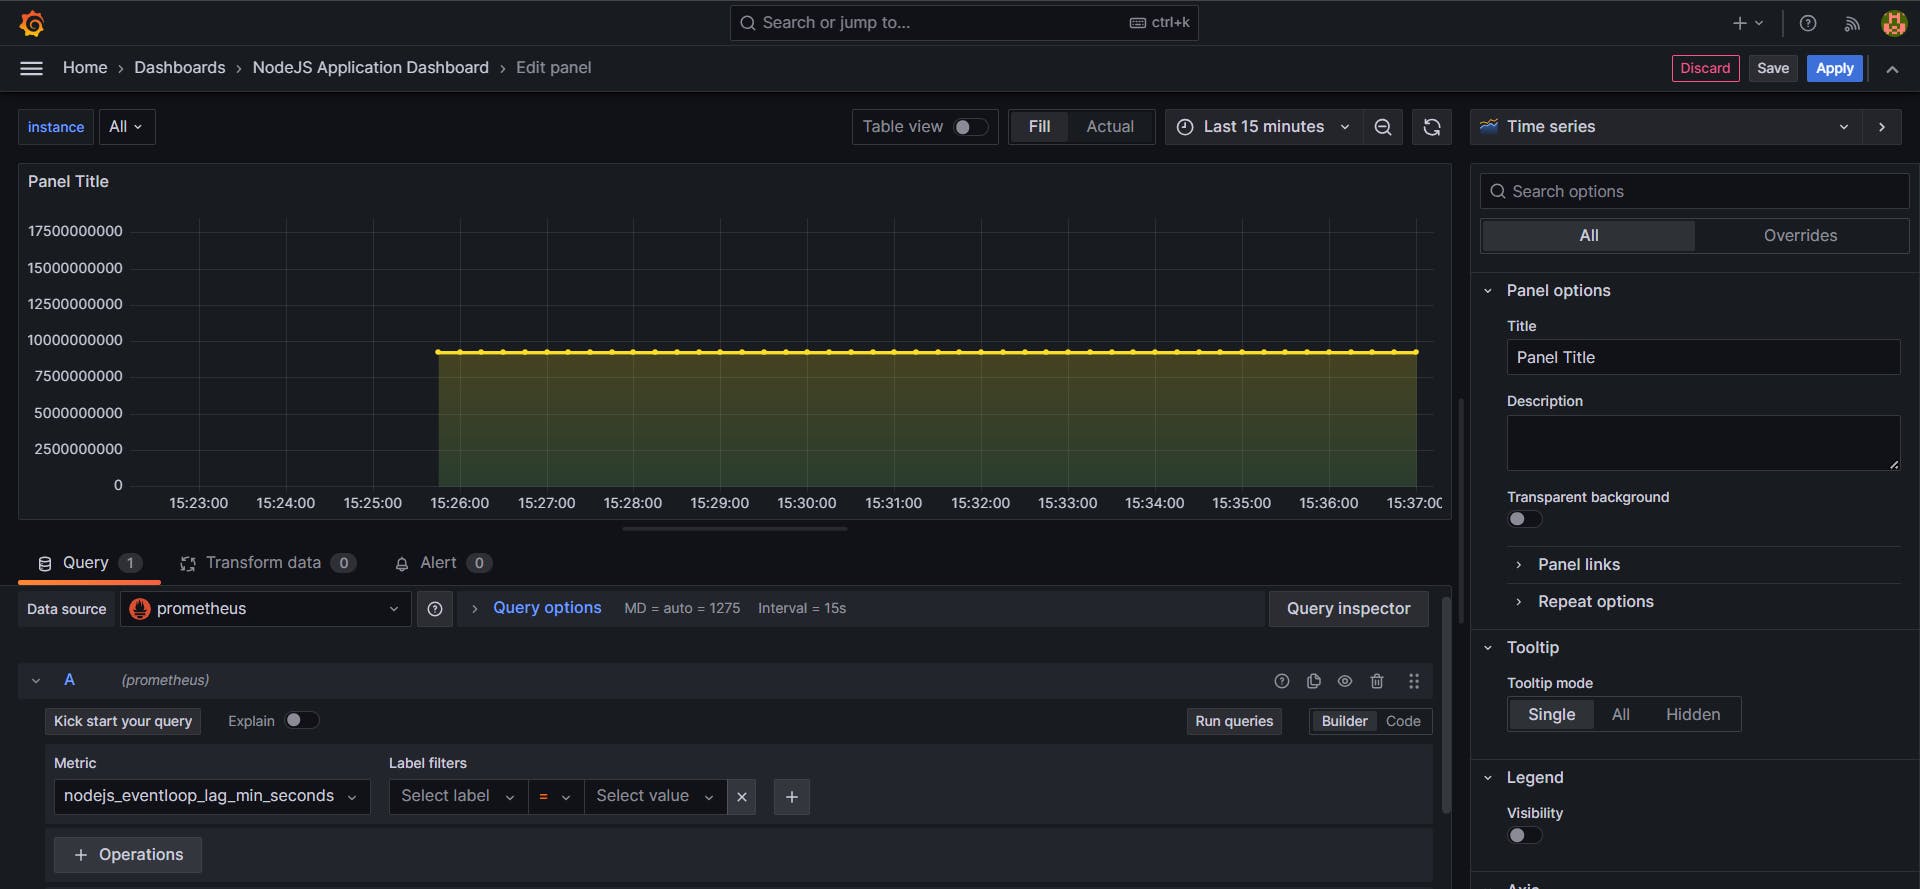
To Create Custom Metrics and visualize them in Grafana:📈
If you want to create your metrics and generate your custom graphs, you can follow these steps:
Content of app.js
// same code as above

const histogram = new client.Histogram({
  name: 'cpu_usage',
  help: 'Custom metric to track CPU usage',
  labelNames: ['label1', 'label2'],
  buckets: [0.1, 0.5, 1, 2, 5, 10],
});

app.get("/custom", (req, res) => {
  const labels = {
    label1: req.query.label1 || 'default',
    label2: req.query.label2 || 'default',
  };

  histogram.labels(labels).observe(Math.random() * 10);

  res.send("Custom metric recorded");
});

//same code as above
Output:
What is Loki?
Loki is an open-source log aggregation system inspired by Prometheus. It is designed to be highly efficient, cost-effective, and horizontally scalable for collecting, querying, and exploring logs from multiple sources. We use Loki to centralize logs from various applications and systems, enabling efficient querying and analysis. Its unique approach to log aggregation focuses on indexing metadata and using a label-based system similar to Prometheus, making it well-suited for cloud-native environments where dynamic labels are prevalent.
Implementation of Loki and visualizing in Grafana📝
Add the below code in app.js
// Importing required modules
const {createLogger} = require("winston"); // Winston for logging
const LokiTransport = require("winston-loki"); // Winston transport for sending logs to Loki

// Configuration options for logger
const options = {
  transports:[
    new LokiTransport({
      host:"http://localhost:3100", // Loki server host
    })
  ]
};

// Creating logger instance with specified options
const logger = createLogger(options);

app.get("/", (req, res) => {
  logger.info("Request is sent on / "); // Logging request information
  res.send("Hello World");
});
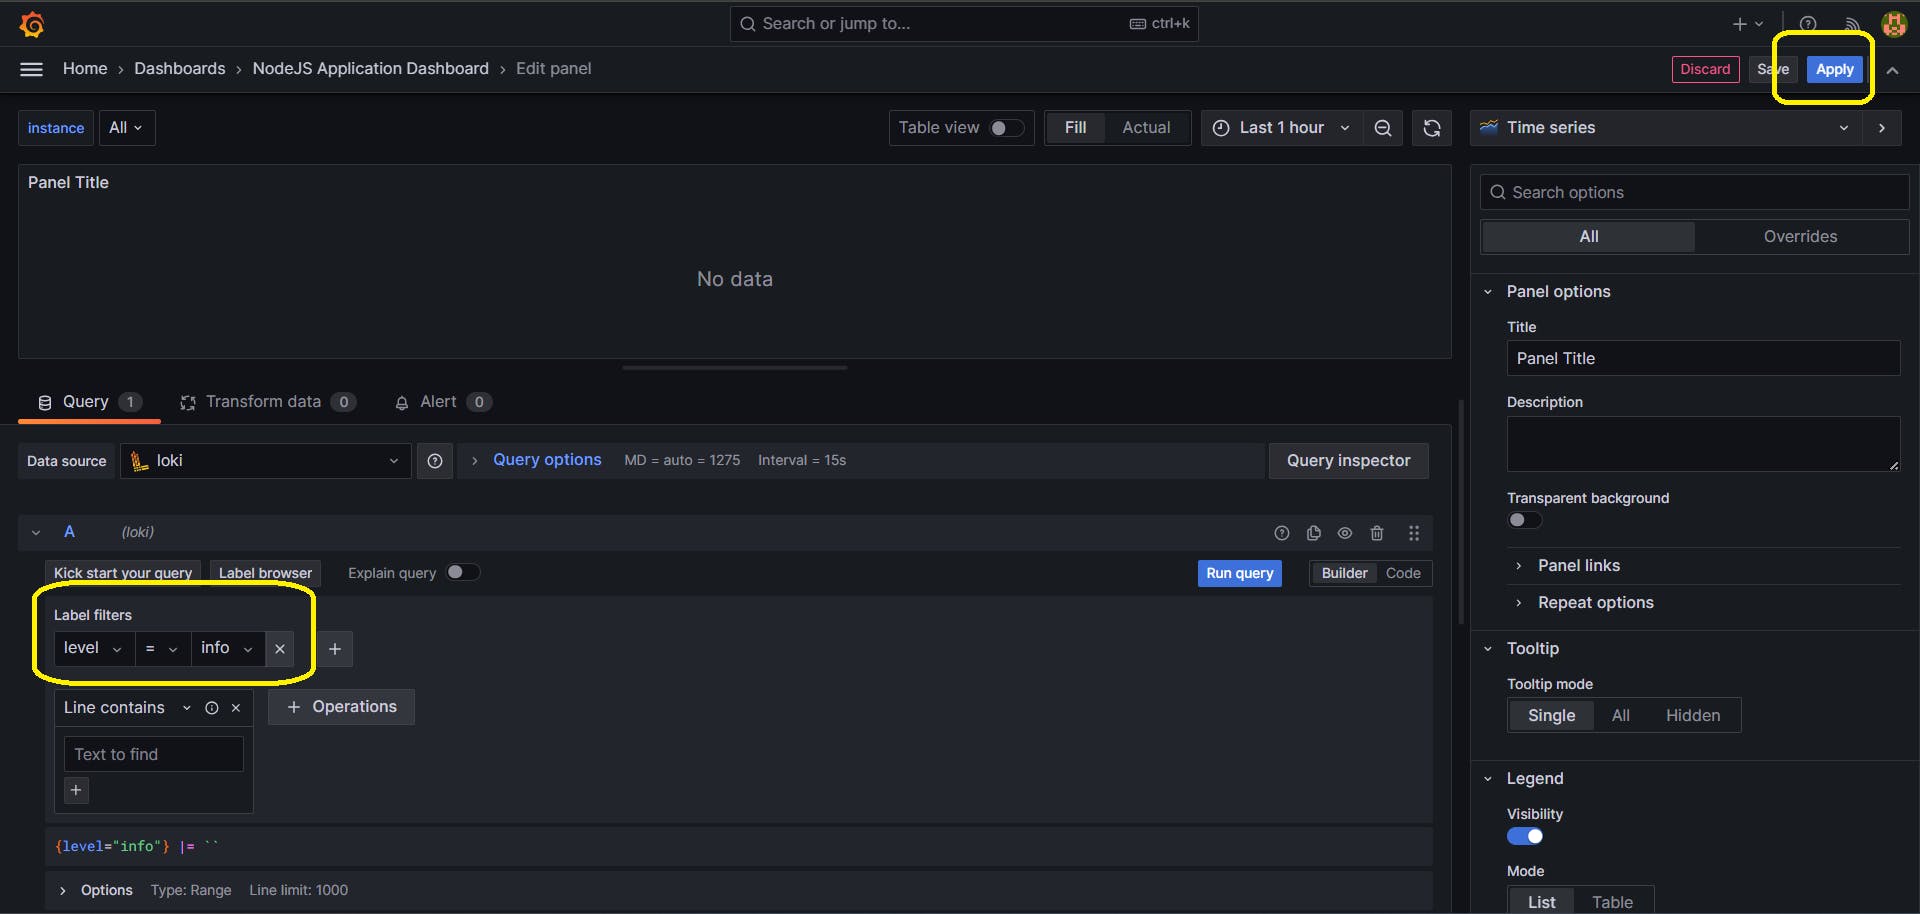
The code sets up a logger using Winston, a logging library for Node.js. It configures the logger to send logs to a Loki server using a Loki transport. When a GET request is made to the root endpoint ("/"), the logger records an informational message indicating a request was sent.
To run Loki on port 3100:
docker run -d --name=loki_final -p 3100:3100 grafana/loki
Output Image of Loki:
Now we add Loki as a data source in Grafana
The steps are similar to those we performed in above Step 4:
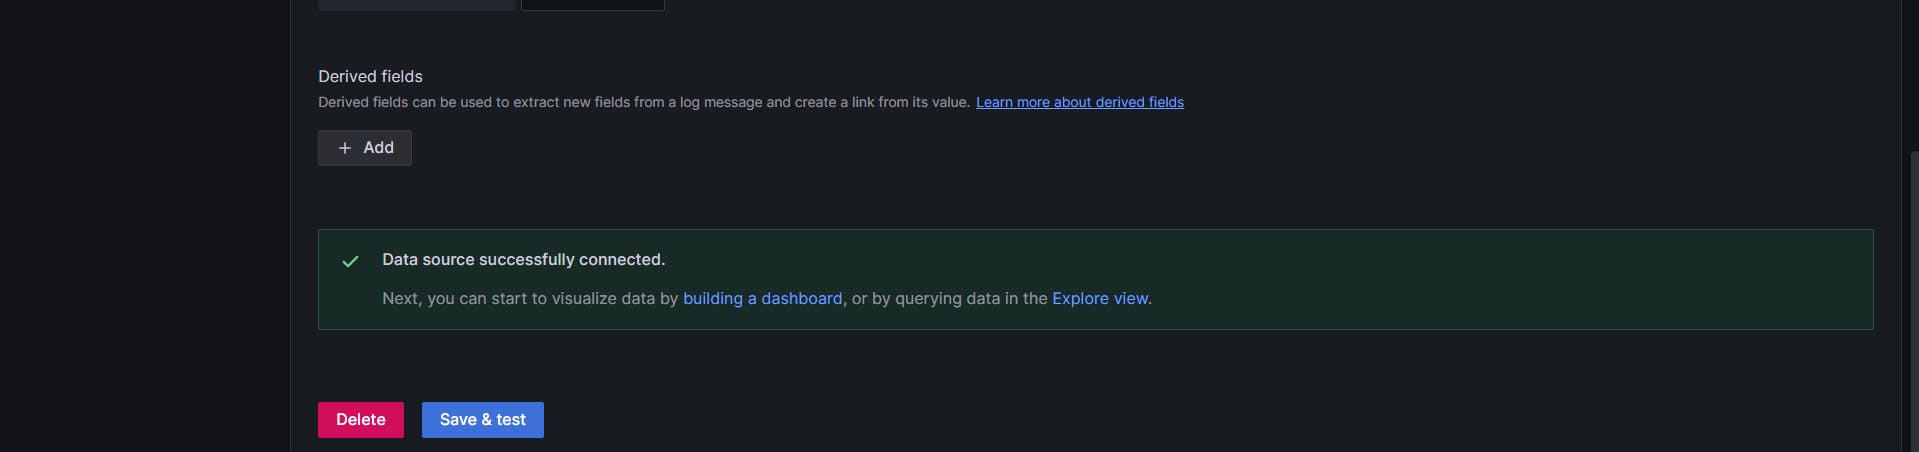
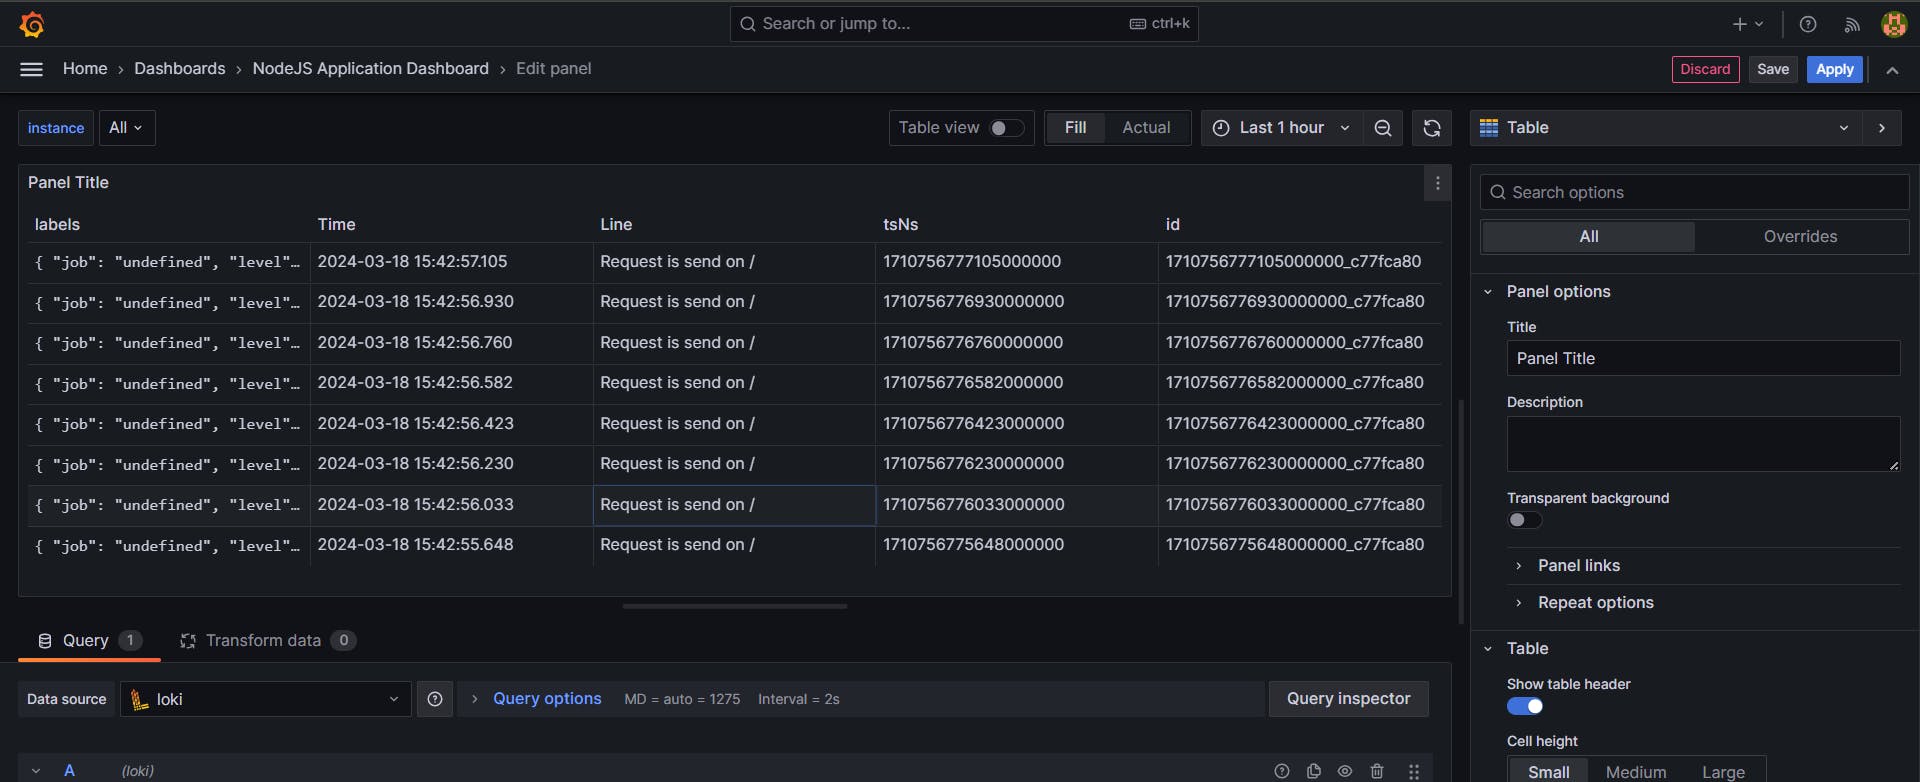
Output:
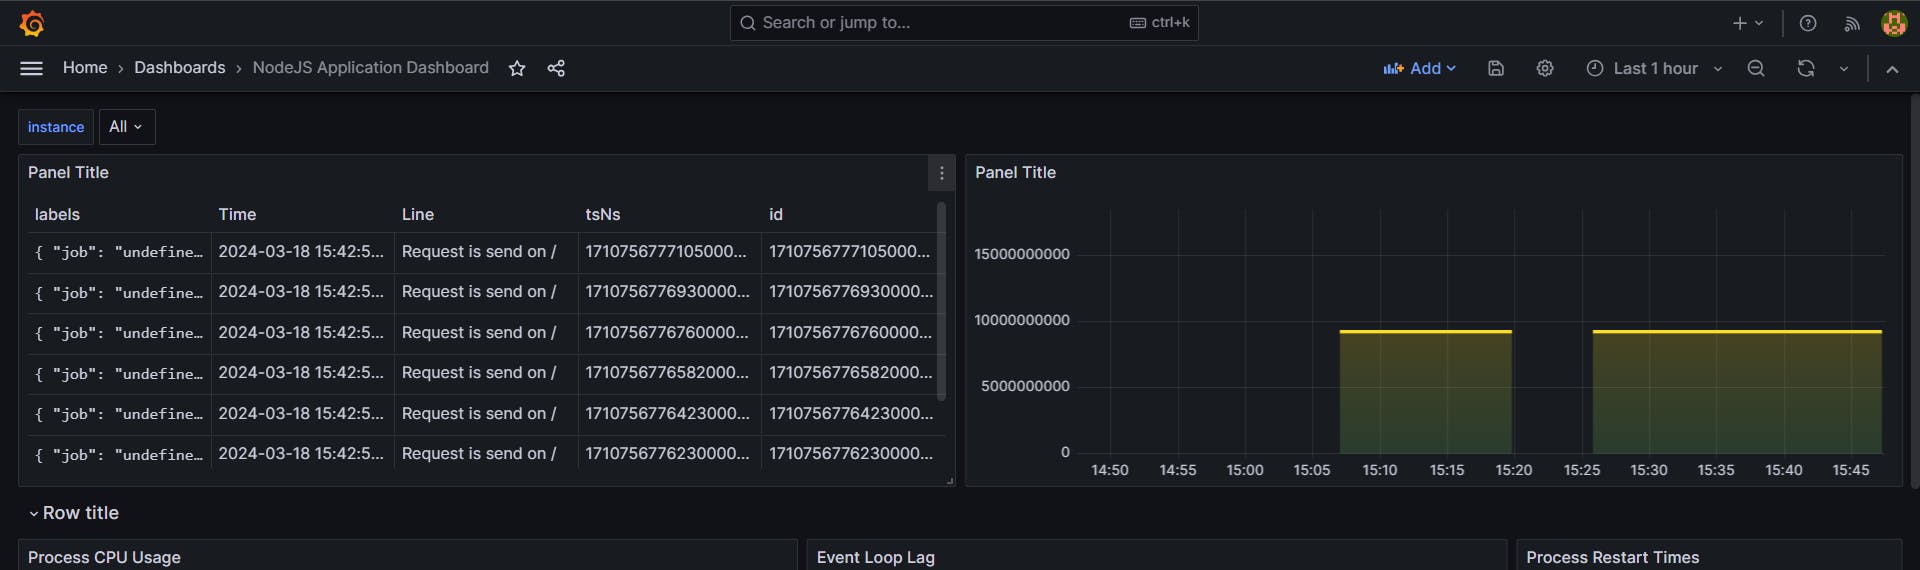
Congratulations to all who have reached the last step:🎉
Final app.js Code:
const express = require("express");
const { doSomeHeavyTask } = require("./util");
const client = require("prom-client"); //Metrics
const {createLogger} = require("winston")
const LokiTransport = require("winston-loki")

const options = {
  transports:[
    new LokiTransport({
      host:"http://localhost:3100",
    })
  ]
}
const logger = createLogger(options)

const app = express();

const PORT = 8000 || process.env.PORT;

const collectDefaultMetrics = client.collectDefaultMetrics;

const histogram = new client.Histogram({
  name: 'cpu_usage',
  help: 'Custom metric to track CPU usage',
  labelNames: ['label1', 'label2'],
  buckets: [0.1, 0.5, 1, 2, 5, 10],
});

app.get("/custom", (req, res) => {
  const labels = {
    label1: req.query.label1 || 'default',
    label2: req.query.label2 || 'default',
  };

  histogram.labels(labels).observe(Math.random() * 10);

  res.send("Custom metric recorded");
});

app.get("/", (req, res) => {
  logger.info("Request is send on / ")
  res.send("Hello World");
});

app.get("/metrics", async (req, res) => {
  res.setHeader("Content-Type", client.register.contentType);
  const Registry = client.Registry;
  const register = new Registry();
  collectDefaultMetrics({ register });
  const metrics = await register.metrics();
  res.send(metrics);
});

app.get("/slow", async (req, res) => {
  try {
    logger.info("Request is send on /slow ")
    const timeTaken = await doSomeHeavyTask();
    return res.json({
      status: "Success",
      message: `Task completed in ${timeTaken} seconds`,
    });
  } catch (error) {
    logger.error("Error in /slow ", error)
    res.json({ status: "Error", message: error.message });
  }
});

app.listen(PORT, () => {
  console.log(`Server is running on port ${PORT}`);
});
Resources🌐:
Thank you for reading till the end !!🙂🙂
💫Do share your valuable feedback. Also, let's connect to explore more tools. 💥